⏱️ Reading time: 14 min
A user reports that checkout took eight seconds. The backend has fourteen microservices, and no single log explains where the time went. That’s the problem OpenTelemetry solves: an open standard that connects traces, metrics, and logs from all those services under a single identifier, without locking you into a monitoring vendor.
📑 En este artículo
- TL;DR
- What Is OpenTelemetry and Why It Matters
- How OpenTelemetry Works Under the Hood
- Practical Examples: Instrumenting a Node.js Service
- Getting Started: From Zero to a Complete Trace
- Real-World Use Cases
- Common Mistakes and Best Practices
- Comparison: Where to Store Your Traces
- Going Deeper: Sampling, Context, and Semantic Conventions
- Frequently Asked Questions
- References
The project was born in 2019 from the merger of OpenTracing and OpenCensus and today it’s one of the most active projects within the Cloud Native Computing Foundation. The difference from traditional monitoring tools is that the code isn’t tied to a vendor: the instrumentation stays the same, regardless of whether the backend ends up being Jaeger, Grafana Tempo, or a paid SaaS.
TL;DR
- You understand the difference between traces, spans, metrics, and logs, and how OpenTelemetry correlates them.
- You install and configure the Node.js SDK with a console exporter and a real OTLP one.
- You spin up a Collector with Jaeger in Docker and visualize your first complete trace.
- You write a manual span for a business operation that automatic instrumentation doesn’t cover.
- You know how to configure a sampler so you don’t capture 100% of traces in production.
- You identify common mistakes: unpropagated context, high-cardinality attributes, and misconfigured sampling.
- You compare four trace backends (Jaeger, Tempo, Zipkin, SaaS) and know which one fits your team.
What Is OpenTelemetry and Why It Matters
OpenTelemetry is a set of APIs, SDKs, and tools for generating, collecting, and exporting telemetry data: distributed traces, metrics, and logs. It’s not a visualization backend or a monitoring service: it’s the instrumentation layer you place in your code, and afterward you decide where to send that data.
Before OpenTelemetry, instrumenting an app meant choosing a vendor-specific SDK and getting locked into it. Migrating vendors meant rewriting the entire instrumentation. OpenTelemetry separates the two: the instrumentation code stays neutral, and the exporter (the piece that sends data to a backend) is swappable with a configuration change, not a code change.
The central use case is the distributed trace: a unique identifier (trace-id) that travels between services, from the moment a user clicks until the response comes back. Each operation within that trace (a SQL query, an HTTP call, a computation) is recorded as a span, with its own start time, duration, and attributes. Chained together, spans form a tree that shows exactly where the time went.
This matters particularly in microservices architectures, where a single user request can pass through ten or twenty different services. Without a shared identifier, each service generates isolated logs, and correlating an error between them requires searching by approximate timestamp, something that breaks down as soon as there’s concurrency.
How OpenTelemetry Works Under the Hood
OpenTelemetry’s architecture has three layers: the API (the interfaces you use in code to create spans and metrics), the SDK (the implementation that processes and exports that data), and the Collector, a separate process that receives telemetry from multiple services, processes it (batching, filtering, enrichment), and forwards it to one or more backends.
Separating the Collector from the app has a concrete advantage: if tomorrow you switch from Jaeger to Grafana Tempo, or add Prometheus for metrics, the change happens in the Collector’s configuration, not in each microservice’s code. The app only needs to know the Collector’s URL, not the final backend’s.
flowchart TD
A["Instrumented app"] --> B["OpenTelemetry SDK"]
B --> C["OTel Collector"]
C --> D[("Jaeger / Tempo")]
C --> E[("Prometheus")]
subgraph Observability
D
E
end
The protocol connecting SDK, Collector, and backend is called OTLP (OpenTelemetry Protocol), and it runs over gRPC or HTTP with Protocol Buffers payloads. It’s the same protocol regardless of language: a Python SDK and a Go SDK send data in the same wire format, which lets you mix services in different languages within a single trace.
That interoperability depends on a smaller but key standard: W3C Trace Context, which defines how the trace identifier travels between services. When service A calls service B over HTTP, it adds a traceparent header with the current trace-id and span-id. Service B reads it, creates its own spans as children of that span-id, and so the entire call chain stays connected under the same trace-id without any service needing to know the system’s full topology.
The three signals OpenTelemetry captures aren’t interchangeable: traces show the path of a specific request with its per-stage latency; metrics aggregate numbers over time (requests per second, 99th percentile latency, memory usage); logs are point-in-time events with arbitrary context. OpenTelemetry correlates them: a log can carry the same trace-id as the trace that generated it, which lets you jump from an anomalous metric to the specific trace and from there to the exact log that explains the error.
Practical Examples: Instrumenting a Node.js Service
The first step is to set up the simplest possible instrumentation, without an external backend, to confirm the SDK starts up and generates spans. This uses ConsoleSpanExporter, which prints each span as JSON in the terminal:
// tracer.js
const { NodeSDK } = require('@opentelemetry/sdk-node');
const { ConsoleSpanExporter } = require('@opentelemetry/sdk-trace-node');

const sdk = new NodeSDK({
  traceExporter: new ConsoleSpanExporter(),
  serviceName: 'checkout-service',
});

sdk.start();
By requiring tracer.js before the rest of the app (node -r ./tracer.js server.js), every HTTP request the server receives automatically generates a span, without touching the route code. A JSON block appears in the terminal for each span, with fields like traceId, spanId, and duration.
The second example replaces the console with a real Collector via OTLP, and adds automatic instrumentation for common libraries (Express, HTTP, MySQL, Redis) with getNodeAutoInstrumentations:
const { NodeSDK } = require('@opentelemetry/sdk-node');
const { OTLPTraceExporter } = require('@opentelemetry/exporter-trace-otlp-http');
const { getNodeAutoInstrumentations } = require('@opentelemetry/auto-instrumentations-node');

const sdk = new NodeSDK({
  traceExporter: new OTLPTraceExporter({
    url: 'http://localhost:4318/v1/traces',
  }),
  instrumentations: [getNodeAutoInstrumentations()],
  serviceName: 'checkout-service',
});

sdk.start();
With this, every incoming and outgoing HTTP call, and every MySQL or Redis query, generates spans without a single extra line in the app’s routes. For business operations that automatic instrumentation doesn’t cover, like a call to a payment gateway, you add a manual span:
const { trace } = require('@opentelemetry/api');
const tracer = trace.getTracer('checkout-service');

async function chargeCard(orderId) {
  return tracer.startActiveSpan('charge-card', async (span) => {
    span.setAttribute('order.id', orderId);
    try {
      const result = await paymentGateway.charge(orderId);
      span.setStatus({ code: 1 });
      return result;
    } catch (err) {
      span.recordException(err);
      span.setStatus({ code: 2, message: err.message });
      throw err;
    } finally {
      span.end();
    }
  });
}
That manual span automatically becomes a child of the HTTP span that originated it: OpenTelemetry propagates the active context within the same process without chargeCard needing to receive the trace-id as a parameter.
Getting Started: From Zero to a Complete Trace
The steps to get traces working in an existing Node.js service are as follows:
- Install the dependencies:
npm install @opentelemetry/sdk-node @opentelemetry/auto-instrumentations-node @opentelemetry/exporter-trace-otlp-http. - Spin up a local Collector. The fastest way is with Docker:
docker run -p 4318:4318 -p 16686:16686 jaegertracing/all-in-one:latest, which exposes the OTLP HTTP port (4318) and the Jaeger UI (16686). - Create the
tracer.jsfile with the SDK pointing tohttp://localhost:4318/v1/traces, as in the previous example. - Start the app preloading the tracer:
node -r ./tracer.js server.js. - Generate real traffic with
curland openhttp://localhost:16686to find thecheckout-serviceservice in the dropdown.
💡 Tip: Always start with ConsoleSpanExporter before adding a Collector. Confirming that spans are generated in your own terminal isolates instrumentation problems from infrastructure problems.
When the request passes through several services, each one adds its own spans under the same trace-id, propagated via the traceparent header:
sequenceDiagram
participant U as User
participant G as API Gateway
participant P as Payment Service
participant D as Database
U->>G: POST /checkout
G->>P: charge order (traceparent)
P->>D: INSERT payment
D-->>P: OK
P-->>G: payment confirmed
G-->>U: 200 OK
Note over G,P: same trace-id across all 3 calls
To confirm the Collector is receiving data without relying on the UI, Jaeger exposes a status endpoint: curl http://localhost:16686/api/services returns the list of services that reported at least one trace. If checkout-service appears in that list, the instrumentation is working end to end.
Real-World Use Cases
The most common case is latency debugging in microservices: when an endpoint is intermittently slow, the trace shows exactly which span consumed the time, without needing to reproduce the problem locally. It’s the difference between checking fifteen different logs with approximate timestamps and opening a single trace with the complete span tree.
Another frequent case is detecting N+1 queries: a trace showing a hundred nearly identical database query spans, all children of the same parent span, is the visual signal of a problem that goes unnoticed in flat logs.

In systems with message queues (Kafka, RabbitMQ, SQS), OpenTelemetry also propagates context asynchronously: the producer adds the trace-id to the message headers, and the consumer picks it up as a child span, even if minutes pass between one event and the next. This connects traces that would otherwise be cut off the moment the message enters the queue.
For vendor migrations, the SDK’s neutrality is the most cited practical advantage: teams migrating from a proprietary SDK to OpenTelemetry keep their instrumentation intact while switching backends, because the coupling point becomes the Collector’s configuration, not each service’s code.
Common Mistakes and Best Practices
The most frequent mistake is not configuring a sampler and leaving capture at the default 100% of traces. In a high-traffic service, that saturates the Collector and drives up the backend’s storage cost, especially with SaaS providers that charge by volume of ingested spans.
⚠️ Watch out: OpenTelemetry’s default sampler captures all traces. In production, it’s better to use a TraceIdRatioBasedSampler that captures, for example, 10% of normal traces and 100% of the ones that end in error.
Another common mistake is failing to propagate context in manual asynchronous calls: if a handler fires a setTimeout or publishes to a queue without copying the active context, the resulting span ends up orphaned, without a trace-id, and appears as an isolated trace instead of connecting to the one that originated it.
It’s also common to overload spans with high-cardinality attributes, like putting user IDs in the span name instead of as an attribute. That breaks aggregation in the backend: each user ends up generating a span with a unique name, and views like slowest operation or 99th percentile per endpoint stop being useful.
Finally, instrumenting only the edge of the system (the API Gateway) and not the internal services gives you an incomplete trace: you see how long the total request took, but not which internal service was responsible. Automatic library instrumentation covers most cases without additional manual effort.
Comparison: Where to Store Your Traces
OpenTelemetry defines how telemetry is generated and transported, but not where it’s stored or how it’s visualized. That decision is independent and can be changed without touching the instrumentation:
| Backend | When to Use It | Advantage | Limitation |
|---|---|---|---|
| Jaeger | Self-hosted, teams that want full control | Open source, CNCF project, mature UI | Requires operating the storage backend (Cassandra, Elasticsearch) |
| Grafana Tempo | Teams already using Grafana, Prometheus, or Loki | Storage on S3-type object storage, cheap at scale | Limited attribute search without Grafana |
| Zipkin | Simple setups, a single service or a few | Lightweight, easy to spin up | Less active than Jaeger, more basic features |
| SaaS (Datadog, New Relic, Honeycomb) | Teams without the capacity to operate their own infrastructure | Zero maintenance, ready-made alerts and dashboards | Recurring cost based on volume of ingested data |
Instrumentation with OpenTelemetry is the same in all four cases: only the exporter URL changes in the Collector’s configuration.
Going Deeper: Sampling, Context, and Semantic Conventions
Sampling decides what percentage of traces gets kept. There are two main strategies: head-based, where the decision is made when the trace starts, before knowing whether it will end in error, and tail-based, where the Collector waits for the trace to finish and decides based on the complete outcome, for example always keeping the ones with an error or latency above a threshold. Tail-based sampling needs a centralized Collector that aggregates all of a trace’s spans before deciding.
💭 Key point: A trace’s context travels as a normal HTTP header (traceparent). No special protocol is needed: any proxy or gateway that doesn’t touch the headers lets the trace pass through intact without additional configuration.
The hierarchy of spans within a trace forms a tree, not a flat list. Each span knows its direct parent, and the backend reconstructs the complete tree from those relationships:
flowchart TD
S1["Root span: POST /checkout"] --> S2["Span: validate-stock"]
S1 --> S3["Span: charge-card"]
S3 --> S4["Span: query-db"]
S1 --> S5["Span: send-email"]
Another advanced concept is semantic conventions: a catalog of standard names for common attributes (http.method, db.system, rpc.service), defined by the project so that two different SDKs, in two different languages, name the same data the same way. Without that convention, each team ends up inventing its own attribute schema, and a dashboard’s queries stop working as soon as a new service uses a different name for the same thing.
Finally, the Collector isn’t just a proxy: it supports processors that transform data in transit, such as redacting attributes with sensitive information (card numbers, emails) before they reach the backend, or adding common attributes to all spans that pass through it, like region or deploy version, without touching each service’s code.
Your next step: spin up the local Collector with docker run -p 4318:4318 -p 16686:16686 jaegertracing/all-in-one:latest and instrument a single endpoint of a project you already have running to see your first real trace in the Jaeger UI.
Frequently Asked Questions
Does OpenTelemetry replace Jaeger or Prometheus?
No. OpenTelemetry generates and transports telemetry; Jaeger, Prometheus, Tempo, or a SaaS are the backends that store and visualize it. They’re complementary pieces, not competitors.
How much overhead does instrumenting an app add?
It depends on the volume of spans and the configured sampler. To measure it in your specific case, compare the endpoint’s 99th percentile latency with and without the SDK active, using the same traffic load in both runs.
Does it work with languages other than JavaScript?
Yes. There are official SDKs for Python, Go, Java, .NET, Ruby, PHP, and more, all compatible with the same OTLP protocol, which lets you mix services in different languages within a single trace.
What’s the difference between a trace and a log?
A trace shows the complete path of a specific request with per-stage timings; a log is a point-in-time event with arbitrary context. OpenTelemetry correlates them by sharing the same trace-id, but they’re distinct signals with distinct purposes.
Do I need a Collector, or can I export directly to a backend?
It’s possible to export directly from the SDK to some backends, but the Collector adds a decoupling layer: it lets you switch backends, apply centralized sampling, and process data in transit without touching each service’s code.
Is OpenTelemetry free?
The project and its SDKs are open source and free, under the Apache License 2.0. The cost, if any, comes from the backend chosen to store and visualize the data, not from the instrumentation itself.
References
- OpenTelemetry: What It Is: official documentation for the project and its history.
- Getting Started with Node.js: official instrumentation guide for JavaScript.
- OTLP Specification: the protocol connecting SDK, Collector, and backend.
- W3C Trace Context: the standard that defines the
traceparentheader. - Jaeger Tracing: one of the most widely used trace backends with OpenTelemetry.
- OpenTelemetry at the CNCF: the project’s page within the Cloud Native Computing Foundation.
📱 Do you like this content? Follow @programacion on Telegram for daily tech content in Spanish: quick summaries, fresh content every day.
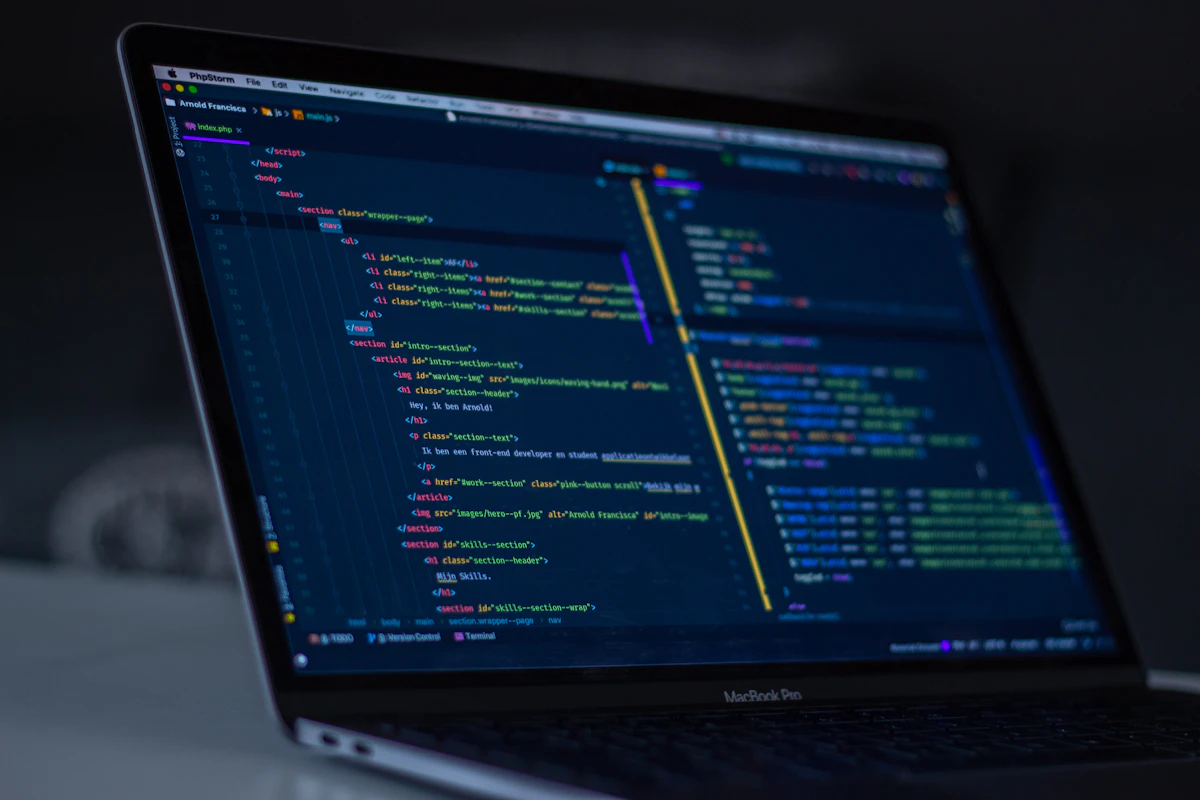
Imagen destacada: Foto de Florian Olivo en Unsplash
Did it work for you? Got a different error? Say so below: questions get answered and help the next reader.
Leave a comment
0 Comments