⏱️ Lectura: 11 min
A steel bridge ages in silence: the crack that compromises its structure almost never gives warning before an engineer spots it with the naked eye during a routine inspection. Researchers at Seoul National University of Science and Technology (SEOULTECH) presented an artificial intelligence framework for long-term bridge monitoring, designed to track that deterioration continuously instead of relying solely on the visual inspections that most countries require every two to five years.
📑 En este artículo
- TL;DR
- What happened
- Context and history
- Technical details and performance
- How to start experimenting with SHM
- Impact of AI bridge monitoring
- What’s next
- Frequently Asked Questions
- What is structural health monitoring (SHM)?
- How does an AI model distinguish real damage from a temperature change?
- What sensors does an instrumented bridge use?
- Are there open datasets for practicing with SHM?
- Does this technology replace the engineers who inspect bridges?
- What’s the difference between event-based monitoring and long-term monitoring?
- References
The proposal adds to a trend that has been growing for more than a decade: instrumenting bridges with cheap sensors and letting a machine learning model interpret those signals in real time. The motivation combines safety and economics. Manually inspecting thousands of bridges is expensive, and years can pass between reviews while structural damage progresses unnoticed.
TL;DR
- SEOULTECH presented an AI framework for continuous long-term structural monitoring of bridges.
- The system aims to detect gradual deterioration, not just discrete events like earthquakes or impacts.
- It uses vibration sensors (accelerometers) and models that separate environmental noise from real damage.
- The core technical challenge is environmental variability: temperature alters the signal almost as much as a crack does.
- The Z24 bridge in Switzerland, monitored before its demolition in 1998, remains the classic SHM benchmark.
- The 2007 collapse of the I-35W bridge in Minneapolis, which killed 13 people, accelerated investment in structural monitoring.
- Below, we show how to prototype an anomaly detector on vibration data with Python.
What happened
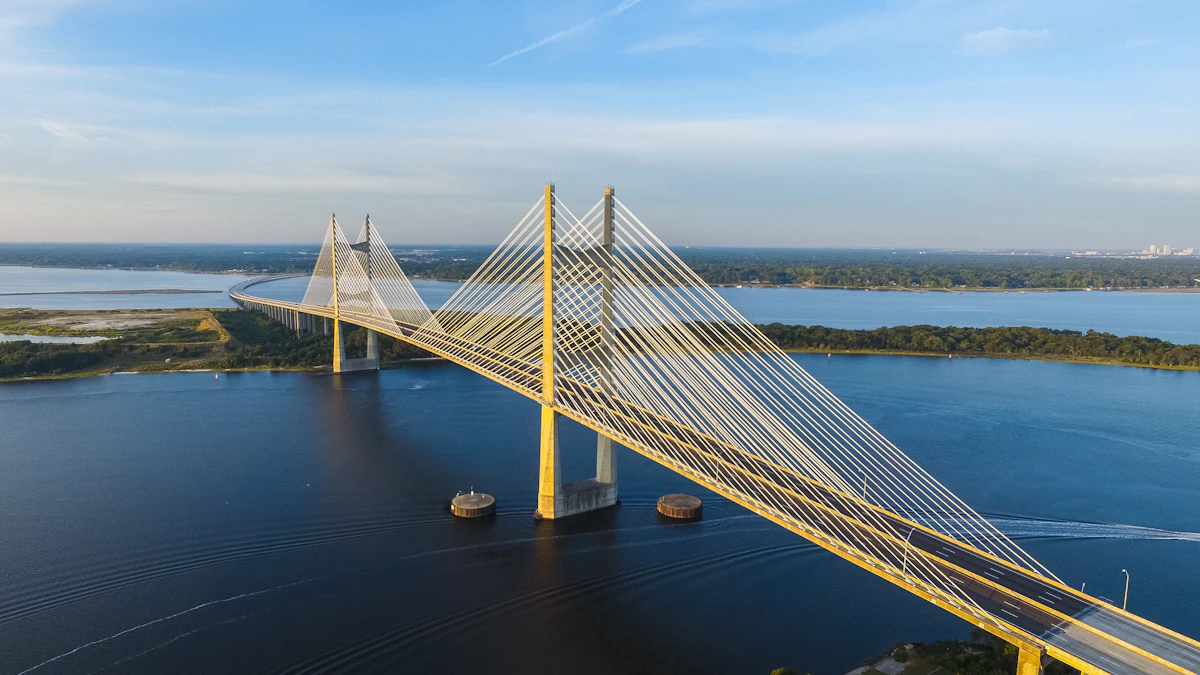
The SEOULTECH team describes its development as a system specifically oriented toward long-term bridge monitoring, an important distinction from already widespread systems that only activate in response to a discrete event: an earthquake, a collision, a sudden excessive load. Instead of waiting for a clear trigger, the framework processes sensor data continuously over months or years, looking for trends that a fixed threshold would not catch.
The announcement, reported by Yahoo Finance, comes at a time when much of the bridge network built between 1960 and 1980 in South Korea, the United States, and Europe is approaching or has already exceeded its original design lifespan. Replacing that infrastructure all at once is economically unfeasible, so the alternative gaining ground is extending its service life with data: knowing exactly which sections need intervention and which can wait.
Context and history
Structural health monitoring (SHM) did not originate with artificial intelligence. For decades, the standard was visual inspection along with complementary methods such as hammer sounding or ground-penetrating radar, carried out by human crews on scheduled visits. The leap toward permanent instrumentation came in the 1990s, when the cost of accelerometers and data acquisition systems dropped.
One of the field’s foundational projects was the Z24 bridge in Switzerland: before its demolition in 1998, a research consortium covered it with sensors for nearly a year, including a period in which controlled damage was deliberately induced. Data from that experiment is still used today as a benchmark to compare damage detection algorithms, precisely because it includes both healthy conditions and real, verified damage.
The other milestone that marked the field was tragic. The collapse of the I-35W bridge in Minneapolis in August 2007, which left 13 dead and more than 140 injured, exposed that a bridge can fail from structural fatigue without periodic inspections catching it in time. The case drove public investment in the United States toward permanent monitoring systems, and over the following decade machine learning began replacing classical modal analysis as the primary tool for interpreting that data.
Technical details and performance
A typical instrumented SHM system combines several types of sensors: accelerometers to capture vibration, strain gauges to measure local deformation, fiber optic sensors for long spans, and increasingly, cameras for computer vision crack detection. Each sensor produces a continuous signal that must be converted into something a model can interpret: natural frequencies, modal shapes, wavelet coefficients, or simply raw time windows.
The artificial intelligence component comes in at the interpretation layer. Since real structural damage is a rare event (there aren’t thousands of labeled examples of a cracked bridge to train a supervised classifier), the dominant approach is unsupervised learning: an autoencoder is trained only on data from a healthy bridge, and then it’s measured how well it reconstructs new data. If the reconstruction error rises consistently, that’s a sign something changed in the structure.
📌 Note: the difficulty isn’t detecting that something changed, but distinguishing a change caused by real damage from one caused by temperature, humidity, or traffic. This is called environmental and operational variability (EOV), and it’s the problem most SHM papers have tried to solve for the past 20 years.
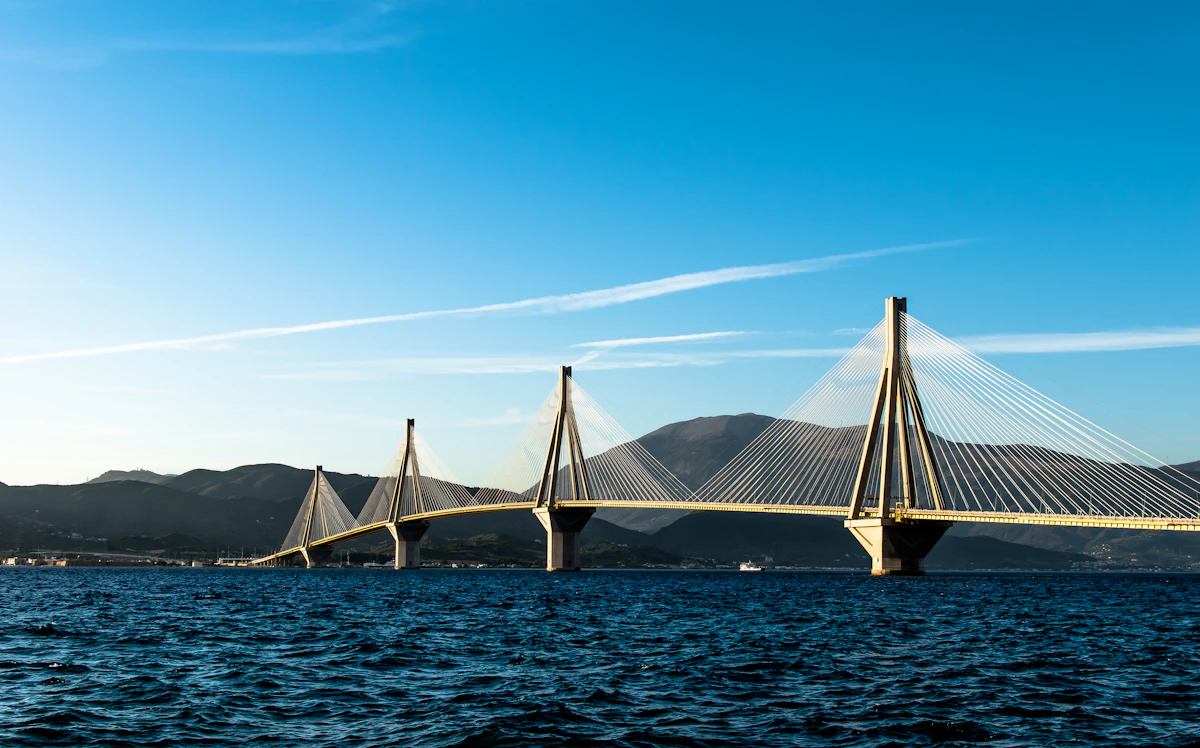
That’s why the word long-term in the name of the SEOULTECH project isn’t cosmetic. A two-week pilot can show good results and still fail in production, because it never saw a full winter. A concrete bridge’s stiffness changes measurably with temperature: its natural frequencies drop as the material heats up and rise as it cools, an effect that can be of the same magnitude as one caused by an actual crack. A model trained on only a few months of data risks mistaking a seasonal change for structural damage.
How to start experimenting with SHM
You don’t need to instrument a real bridge to understand the problem. Open datasets used in SHM research, like the one from the Z24 bridge, let you prototype a full anomaly detection pipeline on a laptop.
💡 Tip: before training any model, plot the raw signal in both the time and frequency domains. Most errors in SHM pipelines are caught at a glance before ever reaching the model.
The first step is always extracting the dominant natural frequencies from a raw vibration signal:
import numpy as np
from scipy.signal import welch

# raw vibration signal from the accelerometer (sample rate: 100 Hz)
sample_rate = 100
vibration_signal = np.loadtxt("sensor_bridge_01.csv", delimiter=",")

frequencies, power = welch(vibration_signal, fs=sample_rate, nperseg=1024)
dominant_frequency = frequencies[np.argmax(power)]
print(f"Dominant natural frequency: {dominant_frequency:.2f} Hz")
This script takes an accelerometer signal sampled at 100 Hz, computes its power spectral density using Welch’s method, and returns the frequency where the most energy is concentrated. That number is the foundation of almost any classical modal analysis.
To go beyond modal analysis and implement the autoencoder approach described above, the PyTorch skeleton is short:
import torch
import torch.nn as nn

class SHMAutoencoder(nn.Module):
    def __init__(self, n_features):
        super().__init__()
        self.encoder = nn.Sequential(
            nn.Linear(n_features, 32), nn.ReLU(),
            nn.Linear(32, 8), nn.ReLU(),
        )
        self.decoder = nn.Sequential(
            nn.Linear(8, 32), nn.ReLU(),
            nn.Linear(32, n_features),
        )

    def forward(self, x):
        return self.decoder(self.encoder(x))

model = SHMAutoencoder(n_features=64)
reconstruction_error = nn.functional.mse_loss(model(healthy_features_batch), healthy_features_batch)
alert_threshold = reconstruction_error.item() * 3  # example: 3x the error under healthy conditions
The model is trained exclusively on data labeled as healthy. Afterward, any new batch of data producing a reconstruction error well above the threshold calculated under healthy conditions triggers an alert for human review, not an automatic decision to close the bridge.
To confirm the pipeline works before relying on it, at minimum you should plot the reconstruction error over a full year and check two things: that it doesn’t follow a purely seasonal pattern (if it rises every winter and drops every summer, the model isn’t properly separating temperature from damage), and that, when a manual inspection record with confirmed damage exists, the error spikes around that date.
flowchart TD
    A["Sensors on the bridge"] --> B["Signal conditioning"]
    B --> C["Feature extraction"]
    C --> D["AI model (autoencoder)"]
    D --> E{"High reconstruction error?"}
    E -->|"Yes"| F["Possible damage alert"]
E -->|"No"| G["Logged as normal"]| Approach | When to use it | Advantage | Limitation |
|---|---|---|---|
| Periodic visual inspection | Low-traffic bridges or limited budget | Minimal cost, no installation required | Only detects damage already visible to the naked eye |
| Fixed-threshold sensors | Bridges in seismic zones or high-impact areas | Immediate alert for a discrete event | Doesn’t distinguish well between real damage and environmental noise |
| Continuous AI monitoring (SHM + ML) | Critical infrastructure with long-term tracking | Detects gradual trends and adapts to seasonality | Requires months of healthy data and ongoing model maintenance |
Impact of AI bridge monitoring
The economic argument behind these kinds of systems is straightforward: an exhaustive visual inspection program across an entire bridge network is slow and expensive, and it still leaves gaps of years between reviews. A continuous monitoring system doesn’t replace human inspection (an engineer is still needed to confirm an alert), but it allows prioritization: instead of inspecting every bridge in a region at the same frequency, physical inspection can be focused on the ones the model flags as suspicious.
The honest limitation is that these systems are still, for the most part, research projects or pilots, not infrastructure deployed at scale. Keeping an AI model running reliably for years requires budget for the physical sensor, which degrades, disconnects, or gets dirty, for periodic model retraining, and for the human team that audits the alerts. A framework published in an academic paper is not the same as a system operating on hundreds of bridges with sustained public funding.
What’s next
The logical next step for a project like SEOULTECH’s is deployment on a real bridge over a long period, something earlier projects like Z24 already attempted, but with the advantage of two more decades of progress in machine learning. It’s also likely that these kinds of systems will integrate with digital twins: computational models of the bridge that update with real-time sensor data and allow simulating how the structure would respond to a hypothetical load before it happens.
In the medium term, the question that will decide whether this technology gets adopted at scale isn’t technical but regulatory: which ministry of transportation or infrastructure agency is willing to accept an alert from an AI model as sufficient grounds to close a lane or schedule an emergency inspection.
📖 Summary on Telegram: View summary
Try it yourself: find the Z24 bridge dataset in an academic SHM repository and run this article’s spectral analysis script on one of its signals to see the dominant natural frequency with your own eyes.
Frequently Asked Questions
What is structural health monitoring (SHM)?
It’s the discipline that uses permanently installed sensors on a structure, such as a bridge or building, to measure its behavior in real time and detect damage before it’s visible to the naked eye.
How does an AI model distinguish real damage from a temperature change?
The most common approach is to train the model on data covering a full seasonal cycle, or to include temperature as an input variable, so the model learns what frequency variation is normal in winter and what isn’t.
What sensors does an instrumented bridge use?
The most common are accelerometers for vibration, strain gauges for local deformation, and, for long spans, fiber optic sensors. An increasing number of projects are adding cameras for visual crack detection.
Are there open datasets for practicing with SHM?
Yes. The most cited case in academic papers is the Z24 bridge in Switzerland, monitored before its demolition in 1998, which includes both healthy conditions and controlled induced damage.
Does this technology replace the engineers who inspect bridges?
No. An AI system prioritizes which bridges or sections need human review most urgently, but confirming the damage and deciding whether to intervene remain the responsibility of a structural engineer.
What’s the difference between event-based monitoring and long-term monitoring?
Event-based monitoring activates in response to a specific trigger, like an earthquake, and assesses the immediate impact. Long-term monitoring processes data continuously over months or years to detect gradual deterioration that no single event would reveal.
References
- Yahoo Finance: report on SEOULTECH’s AI framework for long-term bridge monitoring.
- Wikipedia: definition and overview of structural health monitoring (SHM).
- Wikipedia: details on the 2007 I-35W bridge collapse in Minneapolis.
- Wikipedia: the concept of a digital twin applied to physical infrastructure.
📱 Enjoying this content? Follow @programacion on Telegram for daily tech content in Spanish: quick summaries, fresh content every day. @programacion
Imagen destacada: Foto de Luca Onniboni en Unsplash



0 Comments